


I'm happy to announce my completion of the #CloudGuruChallenge for October! It was a lot of fun building on my learning for AWS certifications. While I've been using some AWS services for projects for myself and clients, the specific requirements for this challenge forced me to explore some new services and stacks I had been meaning to try for some time (like EventBridge, Lambda Layers and ChartsJS).
You can read more about the challenge, its requirements and Forrest Brazeal's motivation behind creating it on the A Cloud Guru blog: #CloudGuruChallenge – Event-Driven Python on AWS.
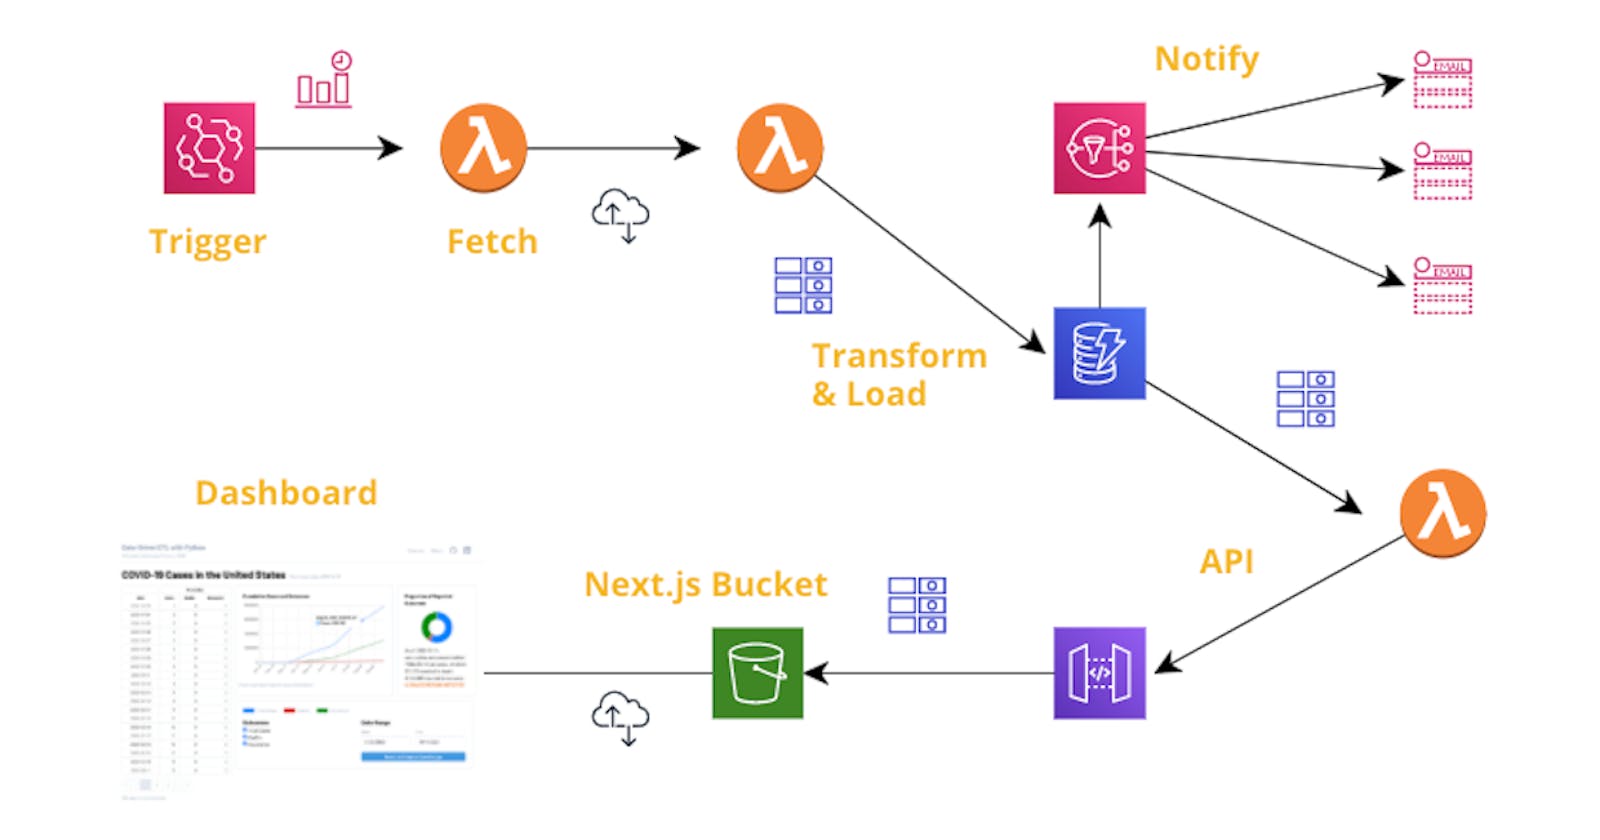
In a nutshell, we were challenged to create a pipeline that would automatically ingest, once per day, 2 datasets of COVID cases and reported outcomes, one global and one for the United States. The datasets must be cleaned and combined into a single set of data for U.S. cases, then loaded into a database for visualizing on a dashboard.
My tools
The stack of services and technologies I used for meeting this challenge were:
- the Serverless Application Model for defining all resources as code,
- AWS EventBridge as the trigger for the ETL pipeline,
- AWS Lambda functions for the ETL, API and daily notification portions of the project,
- a Lambda Layer for the Pandas data library for Python
- SNS as the notification service for daily loads, and for notifying me of an errors that might occur,
- Python for the Lambda runtimes,
- DynamoDB as the data store for the transformed data and checkpoint of the current state of retrievals,
- IAM for custom, least-privilege roles for the ETL Lambda to access DynamoDB and SNS, for the stream Lambda to access DynamoDB's stream and SNS, for EventBridge to invoke the ETL Lambda, and for the API Gateway to log to CloudWatch.
- API Gateway for providing data for the dashboard,
- a domain mapping for the API Gateway (useful to have a stable URL in your frontend code, across any number of stack deletions/creations)
- Next.js with TailwindCSS and the React Query, React Table and ChartsJS/chartsjs-react-2 libraries for visualization.
- an S3 bucket to host the Next.js bundle from.
Step-by-Step
Extraction & Transformation
Packages like Apache Airflow that allow you to orchestrate workflows among different components can be very powerful tools. I've used Airflow for a variety of ETL projects in the past, and now moving into the AWS ecosystem have been interested in exploring how/whether AWS EventBridge could serve much of the same function in the serverless realm. For this challenge, I created a once-daily rule that invokes my ETL Lambda function.
The ETL Lambda consists of 3 modules, one each for fetching, transforming and loading the data. Since I've been using Python for over 15 years, I stuck with that as my runtime and elected to use the very powerful and versatile Pandas library to transform and combine the datasets. Pandas is capable of directly loading CSV and other supported input formats over a URL, so it saved a step for that.
One challenge to using Pandas in a Lambda function is that the library is very large (30.8 MB, zipped) and subsequently prevents you from viewing or editing your code in the Lambda console, should you wish to do so. A solution to this problem is to create a Lambda Layer from the library, for your Lambda function to access. There are a number of challenges to doing this successfully; I found Michelle Lee's blog post Deploying AWS Lambda Layers with Pandas for Data Science invaluable in accomplishing this, especially in how to build your Layer in an Amazon Linux environment without needing to launch an EC2 instance.
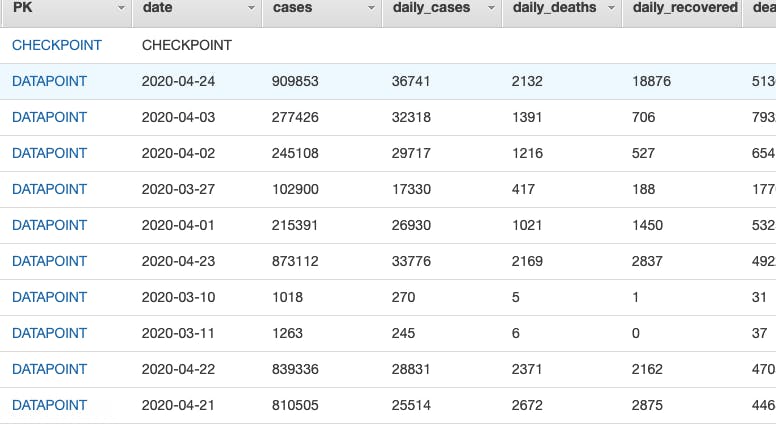
On the initial load, all past data points are stored. For subsequent runs, the ETL Lambda uses a checkpoint set in DynamoDB to determine if this is an initial or an incremental run, and if incremental, what the date of the last successful record to be posted was. All entries in combined Pandas dataframe new since the prior checkpoint are selected for loading.
Loading into a Database
I chose to load the data into DynamoDB (without thinking the whole project through, as I'll discuss below). I've been using SQL databases (both MySQL and PostgreSQL) for years, and I really enjoy some of the new ways of thinking and capabilities that DynamoDB offers. The ability to automatically stream a record of database activity and access that with Lambda or other services is one of those capabilities.
To notify any interested stakeholders that the database (and, accordingly, the dashboard) have been updated, I used a Lambda to parse the DynamoDB stream for updates. To reduce the number of potential notifications (especially during an initial load), I set the stream to batch together up to 1,000 updates or 60 seconds of updates and send a single SNS notification of the results.
Error Handling
I incorporated error handling checks into the fetch, transform and load modules of my ETL Lambda function and into the stream Lambda, and also provided a unit test to check for malformed data. Since I have Pandas loading the URL directly via its read_csv method, it will throw an error directly if the data cannot be parsed. For my own tests, I check for whether the number of columns or column headings of the parsed data veers from the expected, as these changes would create problems downstream in the transformation process.
Dashboard/Visualization
Unfortunately, I realized only after completing the rest of the project that AWS Quicksight was oriented around SQL-structured data sources, and thus could not directly interface with DynamoDB. I could have worked around this in several ways:
- switching my choice of database to RDS
- using Lambda and/or Kinesis Firehose to process the records and store them on S3, for later querying with Quicksight via Athena
- using a service like Redash.io to set up my dashboard, since it can access DynamoDB
I chose not to use RDS, as I wanted to explore new challenges. I could have pursed the Kinesis Firehose route (I would like to learn to use it) but Quicksight (and Redash) is only available for a short-term trial, and I wanted to build something more permanent.
So, I designed and built a dashboard using Next.js, React Query, React Table and ChartsJS/chartsjs-react-2, with data drawn from DynamoDB via API Gateway/Lambda. This was quite challenging, both in learning to restructure the data to the format required by the table and charts, and in designing the dashboard in a way that is both informative and which can be responsive at smaller screen resolutions.
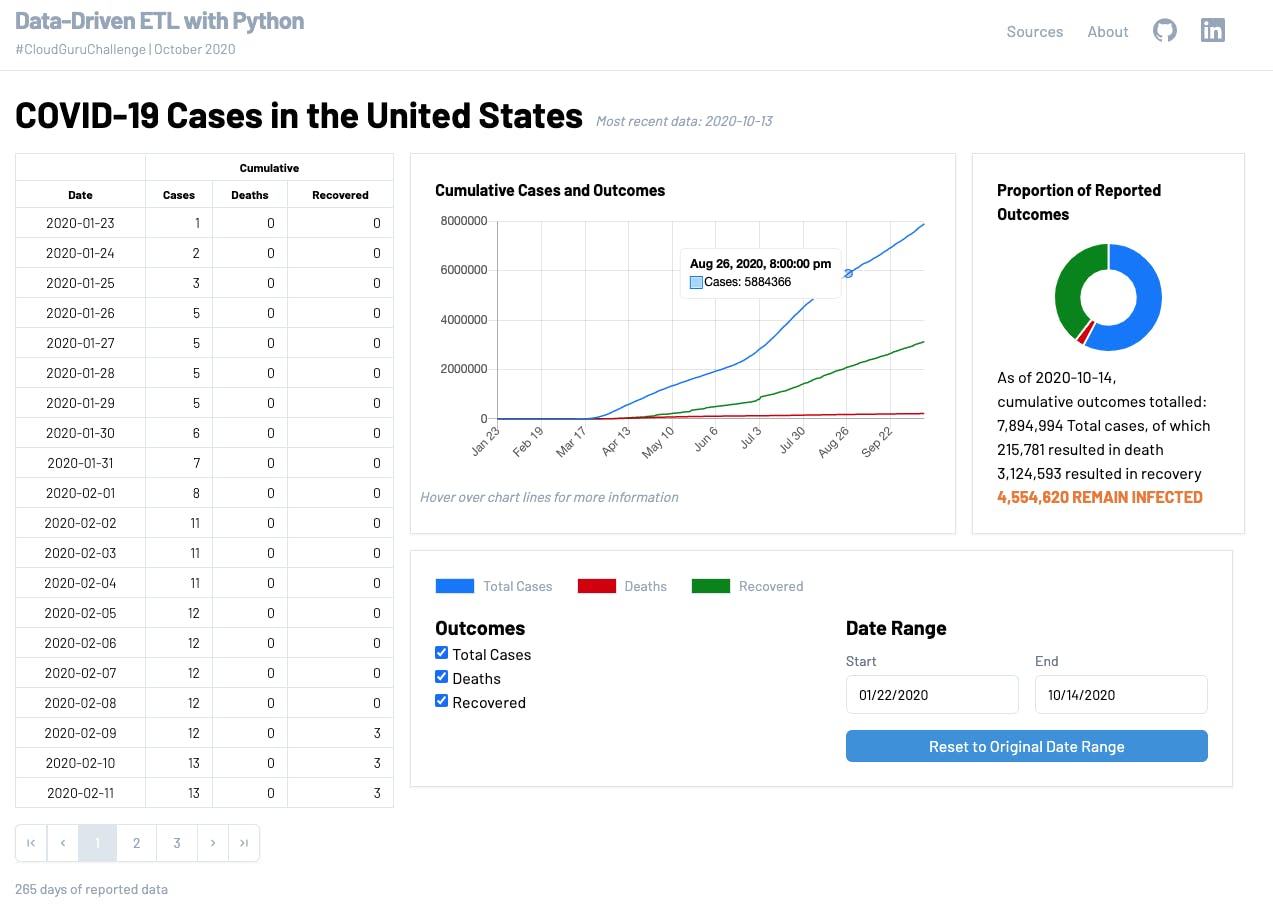
The dashboard – table, charts and toolbar – collapses to a tabbed interface at smaller breakpoints. It could be vastly improved in many ways – for example, the charts render to canvas rather than the DOM, and so resizing them at the lower resolutions is clumsy – but I think it's a great start for the amount of time I could devote to it, and I will be revisiting it over the next week or so completing features I didn't have time to complete before the deadline.
What I would do Differently
I heard about the challenge very close to the deadline, and so I just jumped into it. Had I researched more at the beginning, I would have been aware of the SQL-centric nature of Quicksight, and probably would have explored using Kinesis Firehose and Athena.
I would have spent more time on the dashboard – specifically the what rather than the how. For example, the dataset resulting from the requested transformations has 3 columns – confirmed cases, deaths, and recovered cases, in a cumulative format. This isn't the most useful form to have this data in when constructing a visualization.
Late in the process, I modified my ETL Lambda to calculate 3 additional columns – the daily cases, deaths and recovered – and these are available in data sent by the API, but I haven't yet had time to incorporate them into the dashboard.
Thanks!
A big thank you to Forrest Brazeal and everyone at A Cloud Guru for sponsoring this challenge and taking the time to look over and comment on our efforts.
Links
The completed dashboard/visualization can be seen here. It's still a work-in-progress and a work-of-learning, so flaws are to be expected
The backend (SAM template and Lambda functions) and frontend (Next.js) code for this project is available on GitHub
Connect with me:
here on Hashnode (this is my first post, more to follow),
on the #100DaysOfCloud Discord server,
on LinkedIn, or
on Twitter